

To get detailed help please click on one of the following topics. You can also scroll though the list to find new features and learn more about the budget planning tool MyMicroBalance.
First Steps
Analysis
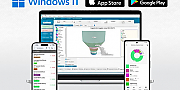
Main User Interface
In the budget planner MyMicroBalance you are able to administrate an unlimited number of accounts. Use Options -> Accounts management to create and edit accounts or to become an overview over your total balance.Show full article >...
The budget planner MyMicroBalance allows you to categorize your income and expenditures. Use Options -> Administration of Categories to arrive at the menu where you can create new groups, delete old ones, or modify them.
|
Once you open the budget planner MyMircoBalance you will see the Start tab. Simply click Start -> Annual Statistics and a new window will be opened that shows the balance sheet as a consolidated annual overview. In this feature you can see different types of statistics for the whole year. Moreover, this feature offers an extensive print...Show full article >
Once you open the Options tab you will see various options such as Auto Open File, Balance, Backup and Debug. The tabAuto Open File enables the automatic loading of a balance file everytime MyMicroBalance is started. Use this feature if you do not like opening a file manually all the time.
Show full article >...
Prior to saving, the budget planner MyMicroBalance creates a backup of your opened balance file. All together, the five last versions of a file are saved. As soon as five backups have been created, backup number one will be overwritten. In case of an emergency, such as a power cut, you will be able to use a backup. The tab will clearly show the options so there you can follow the...Show full article >
Here you can change different settings that will change your balances behaviour. It is possible, for example, to display the last edited month or the current month on start-up. Also use these settings to reset the balance sheets column size and the sort order.Show full article >
Charts are an important way to identify how much money you spent a day or for specific categories of expenditures. Simply click the “Chart” tab and inside you can see certain options.
Bar charts, line charts or pie charts with different values can be created for every single month.


 1
1 2
2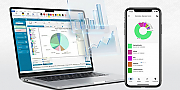 3
3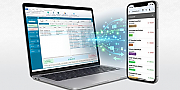 4
4