

The spending ratio shows, as a percentage, how much of your income you spend in total or in a specific category; it is calculated by dividing your (category) expenses by your income and multiplying by 100.
The following table shows sample values. It helps you roughly classify your own spending ratios. The figures are guidelines and are not a substitute for personal financial planning.
| Monthly net income | Category | Monthly expenses in euros | Spending ratio in % | Interpretation |
|---|---|---|---|---|
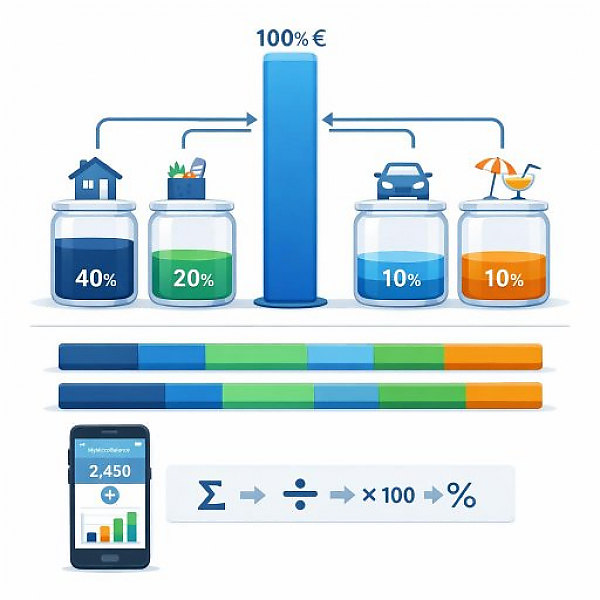
| 1.500 € | Housing (rent, utilities) | 600 € | 40 % | Medium to high; often normal with a lower income |
| 1.500 € | Groceries | 300 € | 20 % | Medium, common |
| 1.500 € | Transportation (public transit, car, bike) | 150 € | 10 % | Low to medium |
| 1.500 € | Leisure & hobbies | 150 € | 10 % | Medium |
| 2.500 € | Housing (rent, utilities) | 900 € | 36 % | Medium, still within the typical range |
| 2.500 € | Groceries | 375 € | 15 % | Medium |
| 2.500 € | Transportation (public transit, car, bike) | 250 € | 10 % | Medium |
| 2.500 € | Leisure & hobbies | 250 € | 10 % | Medium |
| 3.500 € | Housing (rent, utilities) | 1.050 € | 30 % | Low to medium |
| 3.500 € | Groceries | 420 € | 12 % | Low to medium |
| 3.500 € | Transportation (public transit, car, bike) | 350 € | 10 % | Medium |
| 3.500 € | Leisure & hobbies | 350 € | 10 % | Medium |
Important: This classification (low / medium / high) is only a guideline. Your personal situation—for example family, location, or health costs—always plays a major role.
The calculation always follows the same simple pattern:
Formula in short:
Spending ratio in % = (Category expenses per month ÷ Monthly income) × 100
Before you calculate your spending ratios, you need clean data. A digital budget book like MyMicroBalance helps you do that.
Make sure to assign all transactions to a month. That way, your comparison later will be meaningful.
Now calculate the spending ratio for each category. Use this approach:
You can start with the main categories first. Later, you can introduce more detailed subcategories if needed.
Now compare your values with the guidelines from the table.
The goal is not to reach identical values to the table, but to get a feel for your personal distribution.
The spending ratio is especially useful when you track changes over time.
The spending ratio makes your budget comparable and easy to understand. You can compare different months, salary changes, or phases of life even when the absolute euro amounts are different.
With a digital budget book like MyMicroBalance, you have all data in one place. The spending ratio becomes a clear, simple metric that helps you understand your money better and make your day-to-day life more predictable.


 1
1 2
2 3
3 4
4

