

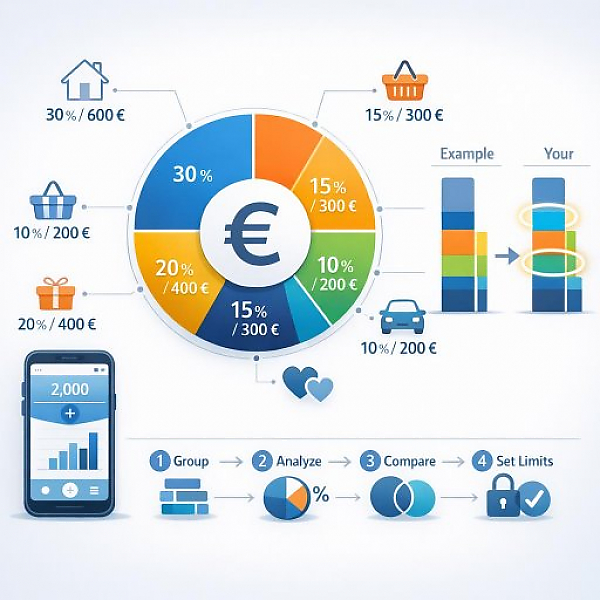
A personal spending profile is a structured overview of how your regular and occasional expenses typically break down across different areas of life (for example housing, transportation, groceries). It shows, in percentages and euros, how much of your net income flows into each spending category so you can realistically plan and compare your budget in a digital household budget.
In the table below you’ll see an example spending profile based on an assumed net income of €2,000 per month. The percentages and euro amounts are not a recommendation, but a rough point of reference. They help you put your own profile into context.
| Spending category | Typical share of net income | Example amount at €2,000 net | Typical examples in this category |
|---|---|---|---|
| Housing | 30 % | €600 | Rent or loan payment, utilities, electricity, heating, internet |
| Food & Groceries | 15 % | €300 | Grocery shopping, beverages, occasional takeout |
| Transportation | 10 % | €200 | Public transit, fuel, auto insurance, repairs, bicycle |
| Health & Personal Care | 5 % | €100 | Medications, copays, glasses, personal care products |
| Insurance & Retirement/Long-Term Planning | 5 % | €100 | Personal liability insurance, home contents insurance, other private policies |
| Leisure, Hobbies & Media | 10 % | €200 | Streaming subscriptions, clubs, sports, culture, books, games |
| Clothing & Shoes | 5 % | €100 | Everyday clothing, sportswear, seasonal clothing |
| Household & Everyday Life | 5 % | €100 | Cleaning supplies, household items, small repairs, workshop supplies |
| Communication & Digital | 3 % | €60 | Cell phone plan, additional data plan, cloud services |
| Gifts & Special Occasions | 4 % | €80 | Birthdays, celebrations, holidays, small donations |
| Buffer & Unexpected Expenses | 8 % | €160 | Unplanned repairs, medical costs, last-minute trips |
The list below helps you assign your own transactions in your household budget to the right categories.
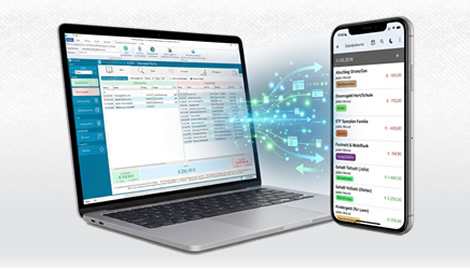
In the following section, you’ll see a simple four-step process. You can implement it directly in a digital household budget tool like MyMicroBalance.
A clearly structured spending profile makes your money behavior visible. At a glance, you can see which areas shape your daily life and where you have room to maneuver. Combined with a digital household budget like MyMicroBalance, individual transactions become an understandable structure. This makes it easier to understand everyday decisions and adjust your budget step by step to your personal goals.

 1
1 2
2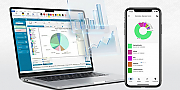 3
3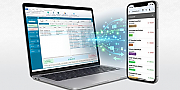 4
4

