

To get detailed help please click on one of the following topics. You can also scroll though the list to find new features and learn more about the budget planning tool MyMicroBalance.
First Steps
Analysis
Main User Interface
The Statistics tab analyzes entries for the month currently selected in the Main Menu. You can switch between Category Overview and Top Ten without configuring a separate report.
The analysis always uses the year and month selected on the left.
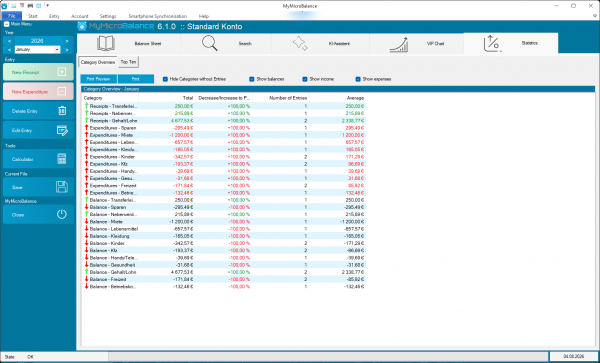
Category Overview groups the receipts, expenditures, and resulting balances of the selected month by category. You can immediately see which areas produced high costs or sufficient income.
Use the checkboxes above the table to show or hide receipts, expenditures, and balances. You can also hide categories without entries.
Colors provide a quick interpretation. Green figures or arrows indicate a positive effect or trend, such as higher receipts or lower expenditures. Red figures indicate a negative effect or trend, such as lower receipts or higher expenditures.
The percentages compare each category with the previous month. This helps you see where the household budget improved and where there may be potential savings.
The Top Ten tab shows the ten highest or ten lowest receipts and expenditures in the selected month. It helps you find large bookings, unusual costs, and possible savings quickly.
Click Print Preview to check the currently displayed analysis before printing. Click Print to print the selected monthly statistics.

 1
1 2
2 3
3 4
4