

To get detailed help please click on one of the following topics. You can also scroll though the list to find new features and learn more about the budget planning tool MyMicroBalance.
First Steps
Analysis
Main User Interface
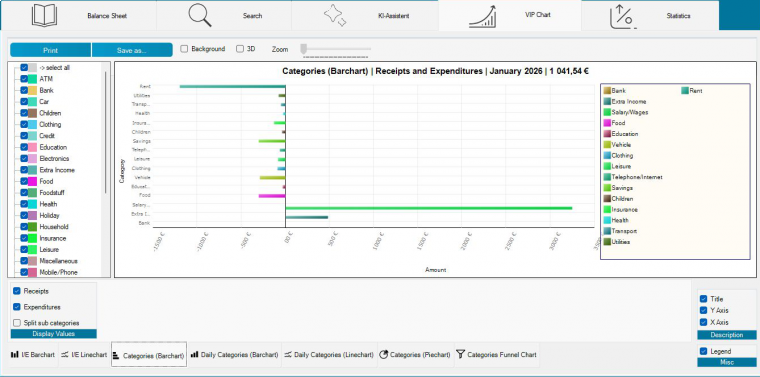
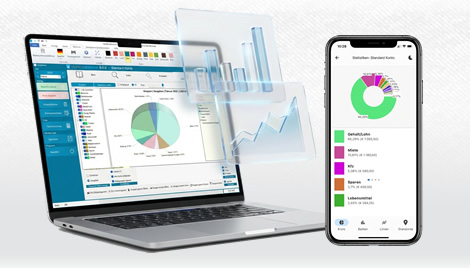
VIP Charts let you analyze your receipts, expenditures, balances, and categories graphically. A month-end balance shows the current result, but charts make it easier to see where money was spent and how individual months differ.
The chart features are available with a VIP license key. They are especially useful for recognizing trends, major areas of expenditure, and differences between months at a glance.
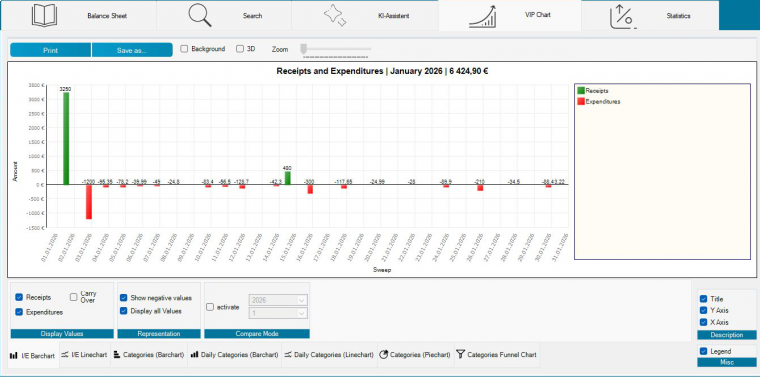
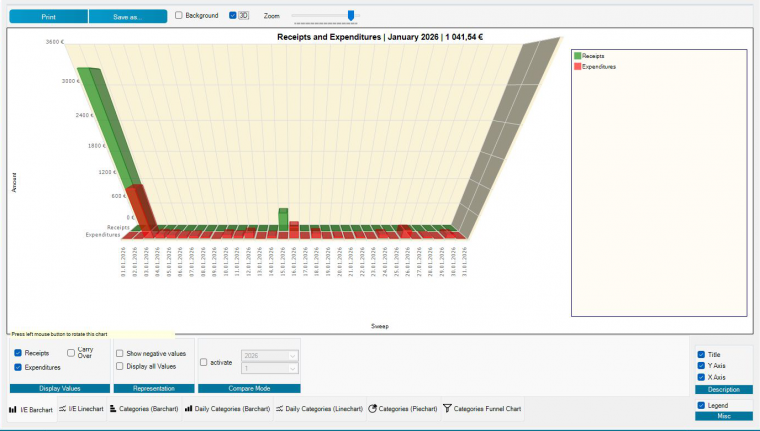
You can adjust the chart display, including the chart type, values, axes, legend, background, and comparison period. This lets you compare receipts and expenditures from different months.

When you analyze a category, you can quickly see which category contributes most strongly to the result. This is useful when you want to reduce expenditures or plan budgets more precisely.

 1
1 2
2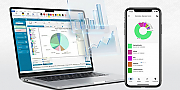 3
3 4
4