

To get detailed help please click on one of the following topics. You can also scroll though the list to find new features and learn more about the budget planning tool MyMicroBalance.
First Steps
Analysis
Main User Interface
The Annual Overview summarizes receipts, expenditures, and balances for a complete budget year. It provides a quick view of monthly figures, categories, Top Ten entries, and graphical trends.
On the Start ribbon tab, the Annual Overview group contains Annual Report Chart, Annual Statistics, and Print Annual Report.
 Annual Statistics opens the table-based analyses for the selected year.
Annual Statistics provides detailed information for the complete year of your Balance Sheet.
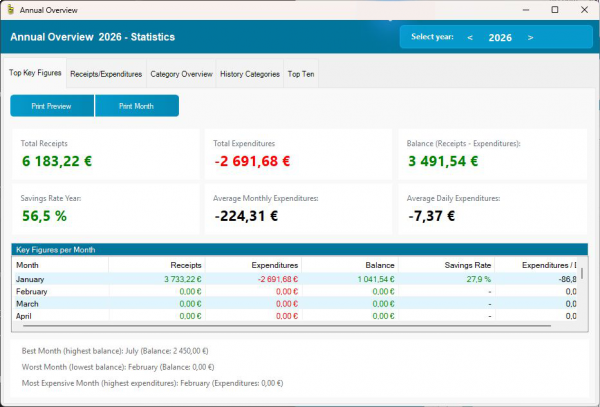
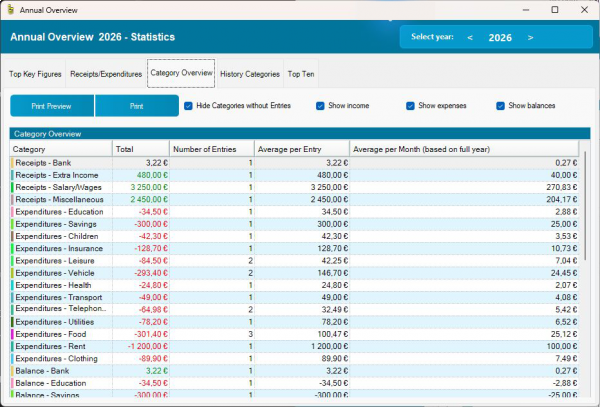
In Category Overview and Category History, select which types of categories should be displayed. Use the checkboxes for receipts, expenditures, and balances.
The selection is carried over automatically between Category Overview and Category History and is saved with your MyMicroBalance file. These filters change only the displayed analysis, not your entries.
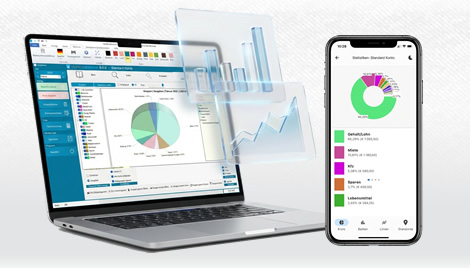
The Annual Report Chart displays the accumulated monthly receipts and expenditures graphically. This makes it easy to recognize the months in which your household budget changed most strongly.
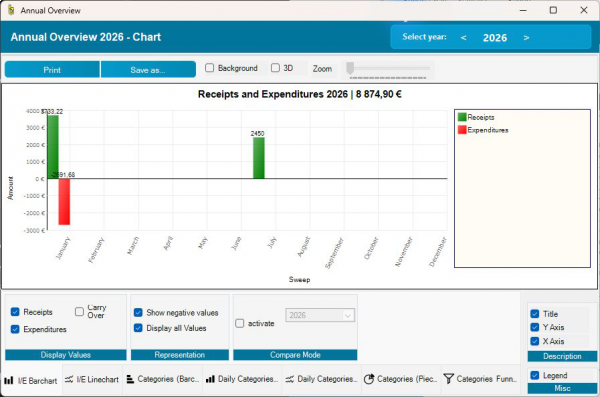
Use the < and > arrow buttons to move between years.
Click Print Annual Report to create a printable annual analysis. Before printing, make sure that the correct year is selected and that the figures in Annual Statistics are plausible.
 Additional charts and analyses are available depending on your license and enabled VIP features. Open VIP Chart or the corresponding chart functions in MyMicroBalance.

 1
1 2
2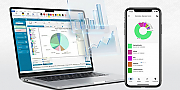 3
3 4
4